WND (Thermospheric crosswinds)#
SERVER_URL = "https://vires.services/ows"
%load_ext watermark
%watermark -i -v -p viresclient,pandas,xarray,matplotlib,cartopy
Python implementation: CPython
Python version       : 3.11.6
IPython version      : 8.18.0

viresclient: 0.12.3
pandas     : 2.1.3
xarray     : 2023.12.0
matplotlib : 3.8.2
cartopy    : 0.22.0
from viresclient import SwarmRequest
import datetime as dt
Product information#
Thermospheric crosswind products are available through the following collections, from non-Swarm spacecraft via the TOLEOS project
CHAMP:
CH_OPER_WND_ACC_2_GRACE 1 & 2:
GR_OPER_WNDxACC_2_GRACE-FO 1:
GF_OPER_WNDxACC_2_
We can check the available parameter names with:
request = SwarmRequest(SERVER_URL)
for collection in ("CH_OPER_WND_ACC_2_", "GR_OPER_WND1ACC_2_", "GF_OPER_WND1ACC_2_"):
    print(f"{collection}:\n{request.available_measurements(collection)}\n")
CH_OPER_WND_ACC_2_:
['Height_GD', 'Latitude_GD', 'Longitude_GD', 'crosswind', 'crosswind_direction', 'local_solar_time', 'validity_flag']

GR_OPER_WND1ACC_2_:
['Height_GD', 'Latitude_GD', 'Longitude_GD', 'crosswind', 'crosswind_direction', 'local_solar_time', 'validity_flag']

GF_OPER_WND1ACC_2_:
['Height_GD', 'Latitude_GD', 'Longitude_GD', 'crosswind', 'crosswind_direction', 'local_solar_time', 'validity_flag']
request.available_times("GF_OPER_WND1ACC_2_")
| starttime | endtime | bbox | identifier | |
|---|---|---|---|---|
| 0 | 2023-01-01 00:00:00+00:00 | 2023-01-01 23:59:50.001000+00:00 | (-90,-180,90,180) | GF_OPER_WND1ACC_2__20230101T000000_20230101T23... |
| 1 | 2023-01-02 00:00:00+00:00 | 2023-01-02 23:59:50.001000+00:00 | (-90,-180,90,180) | GF_OPER_WND1ACC_2__20230102T000000_20230102T23... |
| 2 | 2023-01-03 00:00:00+00:00 | 2023-01-03 23:59:50.001000+00:00 | (-90,-180,90,180) | GF_OPER_WND1ACC_2__20230103T000000_20230103T23... |
| 3 | 2023-01-04 00:00:00+00:00 | 2023-01-04 23:59:50.001000+00:00 | (-90,-180,90,180) | GF_OPER_WND1ACC_2__20230104T000000_20230104T23... |
| 4 | 2023-01-05 00:00:00+00:00 | 2023-01-05 23:59:50.001000+00:00 | (-90,-180,90,180) | GF_OPER_WND1ACC_2__20230105T000000_20230105T23... |
| ... | ... | ... | ... | ... |
| 846 | 2025-04-26 00:00:00+00:00 | 2025-04-26 23:59:50.001000+00:00 | (-90,-180,90,180) | GF_OPER_WND1ACC_2__20250426T000000_20250426T23... |
| 847 | 2025-04-27 00:00:00+00:00 | 2025-04-27 23:59:50.001000+00:00 | (-90,-180,90,180) | GF_OPER_WND1ACC_2__20250427T000000_20250427T23... |
| 848 | 2025-04-28 00:00:00+00:00 | 2025-04-28 23:59:50.001000+00:00 | (-90,-180,90,180) | GF_OPER_WND1ACC_2__20250428T000000_20250428T23... |
| 849 | 2025-04-29 00:00:00+00:00 | 2025-04-29 23:59:50.001000+00:00 | (-90,-180,90,180) | GF_OPER_WND1ACC_2__20250429T000000_20250429T23... |
| 850 | 2025-04-30 00:00:00+00:00 | 2025-04-30 23:59:50.001000+00:00 | (-90,-180,90,180) | GF_OPER_WND1ACC_2__20250430T000000_20250430T23... |
851 rows × 4 columns
Fetching and plotting data#
start_time = dt.datetime(2023, 1, 1)
end_time = dt.datetime(2023, 1, 8)

request = SwarmRequest(SERVER_URL)
request.set_collection("GF_OPER_WND1ACC_2_")
request.set_products(
    measurements=["crosswind", "crosswind_direction", "validity_flag"],
)
data = request.get_between(start_time, end_time)
ds = data.as_xarray()
ds
<xarray.Dataset>
Dimensions:              (Timestamp: 60480, crosswind_direction_dim1: 3)
Coordinates:
  * Timestamp            (Timestamp) datetime64[ns] 2023-01-01 ... 2023-01-07...
Dimensions without coordinates: crosswind_direction_dim1
Data variables:
    Spacecraft           (Timestamp) object '1' '1' '1' '1' ... '1' '1' '1' '1'
    crosswind_direction  (Timestamp, crosswind_direction_dim1) float64 0.0187...
    validity_flag        (Timestamp) int8 0 0 0 0 0 0 0 0 0 ... 0 0 0 0 0 0 0 0
    crosswind            (Timestamp) float64 21.81 19.39 23.24 ... 88.45 87.06
    Radius               (Timestamp) float64 6.868e+06 6.868e+06 ... 6.876e+06
    Latitude             (Timestamp) float64 -42.21 -41.57 ... -14.43 -15.07
    Longitude            (Timestamp) float64 -89.54 -89.56 ... 83.87 83.84
Attributes:
    Sources:         ['GF_OPER_WND1ACC_2__20230101T000000_20230101T235959_000...
    MagneticModels:  []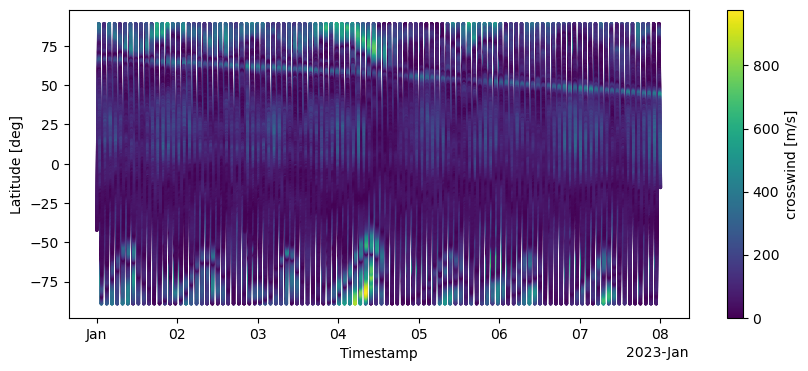
AppliedFilters: []ds.plot.scatter(x="Timestamp", y="Latitude", hue="crosswind", s=2, edgecolors="face", figsize=(10, 4));